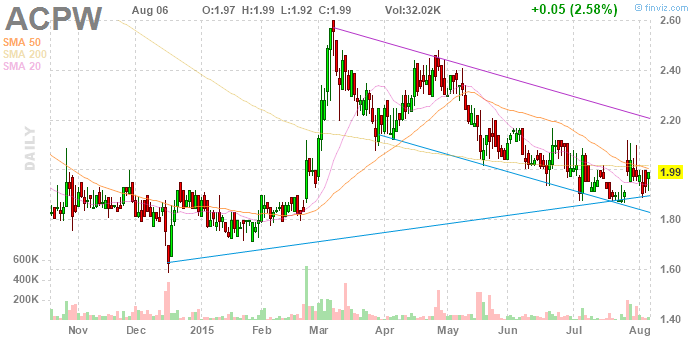
The "pattern" recorded here is the dip to $1.60 in December, which was followed by an instant recovery, and then something shaped like a kind of hook, maybe, which I see again and again, that hook shape ... and, in this instance, there followed a somewhat notable rally.
As usual there are assorted things we could look at. One would be asking how we could have know where the rally was going to top out. There are places to look for clues, in the past, but also clues can develop. A rally of this sort produces broad green bars. Well, the green color is a function of the type of chart, but these are days when the price started low and ended considerably higher, and then, if we look at these examples, most of the bar is above the previous day's bar. Furthermore, there were three such bars made before the price reached $2.40, and the bar that crossed that line was of the same type, but in the case of the first three examples, the next bar stayed high up relative to the big green bar, while, in the case of the final example the next bar sent a long tail all the way down to almost the bottom of the big green bar. That turned out to signal the top.
I see this making a second, bigger hook, now, so I'm predicting a rally to something like $3, in two or three months. You might note the theme that's developing, which is the notion that small patterns are followed by larger images of themselves. You might also note that this chart only predicts a 50% gain, where ABIO predicted a 100% gain, speaking now about what I think is going to happen during the rest of 2015. Hmm. Maybe I'm selling the pattern short. Measuring off the hook, the rally in February carried quite far. Well, we'll see. I feel silly, launching right into predictions this way, but I can't help myself. By the way, this is number 6 out of 600.
No comments:
Post a Comment